

*Dr. Prashant Kumar Jha, Head, Quality Control Laboratories, ALNRMAMC, Koppa
*Corresponding Author: [email protected]
Received on: 30-01-2023 Accepted: 05-02-2023 Corrected: 10-02-2023

Abstract: Background: Undernutrition is a detrimental condition for health and development of any nation. In India, it 16.3% population are affected by this resulting in various indicators of malnutrition including stunting, wasting, underweight and micronutrient deficiencies. Stunted growth is a result chronic malnutrition. Dietary practices and insistence based of lack of education and cultural practices also play pivotal role in deterioration of the condition. Five districts are from Uttar Pradesh and Bihar in bottom 10 districts with stunted growth.
Materials and Methods: The data of stunted growth, literacy rate, multidimensional poverty index of various states and union territories, top 10 and bottom 10 districts of India will be collected based on government’s statistics.
Result: The range of stunted growth in state and union territories of India varies from 47% to 20%. Seven states and union territories are above national average while 29 are below national average. Literacy rate of 9 districts in top bottom category are below national rate. All districts in top 10 bottom categories are having multidimensional poverty index less than national percentage.
Discussion and Conclusion: Education and multidimensional poverty index make a mindset of greater population negligence towards health. Lack of optimal maternal nutrition brings epigenetic changes. Such changes affect the gene expression responsible for the various metabolic and physiological function. Transgenerational transmission of genetic information carried by gene brings changes in long term also results in stunted growth.
Keywords: Malnutrition, Undernutrition, Stunted Growth, India………..
Malnutrition is a serious problem reflected with major health issues. It refers to deficiencies or excesses in nutrient intake causing imbalance of essential nutrients1. Imbalances in these nutrition may be undernutrition or overweight. As per data of World Bank, the percentage population of India undernutrition increased from 14.9% in 2012 to 16.3% in 20212. Undernutrition is damaging condition, as nutrients are essential for health and developments. It provides energy and components of tissue building in forms carbohydrates, fats and proteins. Vitamins and minerals are essential for enzymes, hormones and other body requirements3,4. Wasting, stunting, underweight and micronutrient deficiencies are four indicators or forms of undernutrition1. Wasting and stunting are respectively related to acute and chronic malnutrition5.
Stunted growth is failure of linear growth and is defined as, “percentage of children, aged 0 to 59 months, whose height for age is below minus two standard deviations (moderate and severe stunting) and minus three standard deviations (severe stunting) from the median”6. It is associated with reduced neurodevelopment and cognitive functions. Various other pathological disorders including chronic diseases in adulthood are linked to stunting7. Socioeconomic status, parental education, maternal undernutrition, infectious diseases in pregnancy and after birth etc. are various factors causing stunting8,9. Social and cultural factors are also important for undernutrition10.
Dietary practices are reflection of social and cultural factors and in long term they contribute to genetic changes. Diet is able to modulate gene expression11. Mutation of single gene involved with stature development results in various phenotypical changes leading to short stature12. Gene responsible for growth inheritance of DNA sequence. So, stunting up to the age of 5 years is result of interplay between genetic and environmental factors. Meghalaya, Bihar and Uttar Pradesh are top three states of India with stunted growth13,14. District-wise maximum stunted growth is noted in Pashchimi Singhbhum of Jharkhand (60.6%) and minimum in Jagatsinghapur of Odisha (13.2%). Understanding of causes behind such variation is objective of present study.
2. Materials and Methods
The data of stunted growth of various states and union territories of India will be collected from National Family Health Survey Report 2019-202114. Data on top 10 and bottom 10 districts in stunted growth will be collected from Press Information Bureau website13,14. Data related to literacy rate, multidimensional poverty index etc. will be collected based on government’s statistics.
3. Result
Data of Stunted growth
Range of percentage of stunted growth between states or union territories14 : 47 – 20
Indian average of stunted growth14 : 36
Number of states or Union territories above or equal to Indian average14 : 7
Population percentage of 7 states and union territories above or equal to Indian average15 : 40.43%
Number of states or union territories below to Indian average14 : 29
Number states or union territories between 30 % and 35%14 : 15
Percentage of population of states or union territories between 30 % and 35%15 : 44.41%
Number of states or union territories below 30 %14 : 14
Percentage of population of states or union territories below 30 %15 : 15.16%
Range of percentage of stunted growth between highest and lowest percentage in district14 : 60.6 – 13.2
Number of districts with literacy rate less than country’s literacy rate in bottom 10 districts’ category16 : 9
Number of districts with literacy rate more than country’s literacy rate in top 10 districts’ category16 : 7
Chart Number: 1
States or Union Territories With Percentage of Stunted Growth More or Equal to National Percentage

Chart Number: 2
States or Union Territories With Percentage of Stunted Growth Less Than National Percentage

Chart Number: 3: Literacy Rate of Top 10 and Bottom 10 Districts

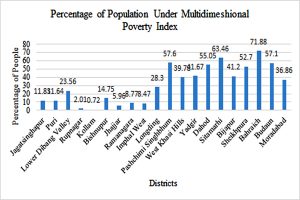
Chart Number: 4: Multidimensional Poverty Index of Top 10 and Bottom 10 Districts
4. Discussion and Conclusion
The range of percentage of stunted growth in different states and union territories of is noted in between 47 to 20. Out 36 states and union territories 7 states and union territories is having percentage equal or more than national percentage with population percentage of 40.43%. It means the national percentage of burden of stunted growth increases due to these states and union territories. Only 15.16% population is noted below 30% of stunted growth, remaining (44.41%) being in between of 30% to 35%.
Among the top 10 districts least affected by stunted growth in India, two are from each of Odisha, Arunachal Pradesh and Manipur while one is from each of Punjab, Kerala, Haryana and Karnataka. Among the bottom 10 districts most affected by stunted growth in India, three and two districts are respectively from Uttar Pradesh and Bihar. One each is from Jharkhand, Meghalaya, Karnataka, Gujarat and Chhattisgarh.
Literacy rate of 9 out of bottom 10 districts is below national literacy rate while literacy rate of 7 out of top 10 districts is above national literacy rate. The literacy rate of India is continuously increasing since India got freedom. It reached from 18.33%17 in 1951 to 77.7%18 in 2022. Lack of complementary feeding education is major cause of stunted growth as optimal maternal nutrition is an essential component of natal and infant development20. Nutrigenomic and nutrigenetic studies have shown the transgenerational transmission of epigenetic changes if nutrition is lacked for generations21,22. Similarly, modifications in epigenetic changes are also shown through nutritional diet22. Epigenetic mechanism in mother triggers alteration of various gene expressions affecting the foetal development23. Education is also related with life-style changes and precautions during pregnancy. If appropriate diet and exercise are not adopted by pregnant woman, health of infants get affected.
The most recent data on multidimensional poverty index (MPI) refers to 16.4% population in India is multidimensionally poor24. The MPI is based deprivation of health, education and standard of living25. Health includes nutrition, child & adolescent mortality and antenatal care while education includes, years of schooling and school attendance25. Standard of living includes sanitation, drinking water, electricity, housing, assets and bank account25. All of these three indicators are directly related with health directly and indirectly. District-wise data shows a wide range of population percentage with MPI in India varying from 71.88- 0.72. Only 2 districts out of top 10 districts is having more population percentage than national average while all districts 10 districts in bottom 10 districts are above national percentage.
Priorities of human beings depend upon the level of poverty and available resources. First priority is earning money, then health and education. If money is not enough to satisfy the basic requirements, then other problems are not seriously taken by poor people. Accordingly, policies and planning should be done. Nutrition may be direct factor in case of our country, but number of other factors, directly and indirectly associated to each other also cause the stunted growth. Nutrition must be taken in context with priority. Stepwise honest approach can improvise the condition. People must be taught about the future of their generational requirements. Involvement of individual organizations under strict supervision of government is need of time.
Conflict of Interest: No Conflict of Interest exists as declared by author.
References:
1. Available on: https://www.who.int/health-topics/malnutrition#tab=tab_1 (accessed on: 12-01-23)
2. Available on: https://databank.worldbank.org/reports.aspx?source=2&series=SN.ITK.DEFC.ZS&country= (accessed on 12-01-23).
3. Ward E. (2014). Addressing nutritional gaps with multivitamin and mineral supplements. Nutrition journal, 13, 72. https://doi.org/10.1186/1475-2891-13-72
4. Kim, M., Basharat, A., Santosh, R., Mehdi, S. F., Razvi, Z., Yoo, S. K., Lowell, B., Kumar, A., Brima, W., Danoff, A., Dankner, R., Bergman, M., Pavlov, V. A., Yang, H., & Roth, J. (2019). Reuniting overnutrition and undernutrition, macronutrients, and micronutrients. Diabetes/metabolism research and reviews, 35(1), e3072.
5. de Onis, M., & Blössner, M. (2003). The World Health Organization Global Database on Child Growth and Malnutrition: methodology and applications. International journal of epidemiology, 32(4), 518–526. https://doi.org/10.1093/ije/dyg099
6. Available on: https://www.unicef.org/india/what-we-do/stop-stunting#:~:text=Stunting%20causes%20irreversible%20physical%20and,and%20development%20in%20early%20life. (accessed on: 12-01-23)
7. de Onis, M., & Branca, F. (2016). Childhood stunting: a global perspective. Maternal & child nutrition, 12 Suppl 1(Suppl 1), 12–26. https://doi.org/10.1111/mcn.12231
8. Black, R. E., & Heidkamp, R. (2018). Causes of Stunting and Preventive Dietary Interventions in Pregnancy and Early Childhood. Nestle Nutrition Institute workshop series, 89, 105–113. https://doi.org/10.1159/000486496
9. Mulyaningsih, T., Mohanty, I., Widyaningsih, V., Gebremedhin, T. A., Miranti, R., & Wiyono, V. H. (2021). Beyond personal factors: Multilevel determinants of childhood stunting in Indonesia. PloS one, 16(11), e0260265. https://doi.org/10.1371/journal.pone.0260265
10. Singh, A. (2020). Childhood Malnutrition in India. Perspective of Recent Advances in Acute Diarrhea. doi: 10.5772/intechopen.89701
11. Franzago, M., Santurbano, D., Vitacolonna, E., & Stuppia, L. (2020). Genes and Diet in the Prevention of Chronic Diseases in Future Generations. International journal of molecular sciences, 21(7), 2633. https://doi.org/10.3390/ijms21072633
12. Rohani, W., Taib, W. and Ismail, I. (2021). ‘Evidence of stunting genes in Asian countries: A review. Meta Gene. 30. Article 100970. https://doi.org/10.1016/j.mgene.2021.100970.
13. https://pib.gov.in/PressReleasePage.aspx?PRID=1806601
14. https://dhsprogram.com/pubs/pdf/FR375/FR375.pdf
15. Available on: https://statisticstimes.com/demographics/india/indian-states-population.php (accessed on: 16-01-23).
16. Available on https://www.niti.gov.in/sites/default/files/2021-11/National_MPI_India-11242021.pdf (accessed on: 16-01-23).
17. Available on https://www.indiabudget.gov.in/budget_archive/es2006-07/chapt2007/tab94.pdf (accessed on: 18-01-23).
18. Available on https://timesofindia.indiatimes.com/education/news/international-literacy-day-2022-theme-significance-history/articleshow/94065106.cms (accessed on: 18-01-23).
19. Prendergast, A. J., & Humphrey, J. H. (2014). The stunting syndrome in developing countries. Paediatrics and international child health, 34(4), 250–265. https://doi.org/10.1179/2046905514Y.0000000158
20. De Sanctis, V., Soliman, A., Alaaraj, N., Ahmed, S., Alyafei, F., & Hamed, N. (2021). Early and Long-term Consequences of Nutritional Stunting: From Childhood to Adulthood. Acta bio-medica : Atenei Parmensis, 92(1), e2021168. https://doi.org/10.23750/abm.v92i1.11346
21. National Research Council (US) Committee on Diet and Health. Diet and Health: Implications for Reducing Chronic Disease Risk. Washington (DC): National Academies Press (US); 1989. 4, Genetics and Nutrition. Available from: https://www.ncbi.nlm.nih.gov/books/NBK218767/
22. Franzago, M., Santurbano, D., Vitacolonna, E., & Stuppia, L. (2020). Genes and Diet in the Prevention of Chronic Diseases in Future Generations. International journal of molecular sciences, 21(7), 2633. https://doi.org/10.3390/ijms21072633
23. Salilew-Wondim, D., Tesfaye, D., Hoelker, M., & Schellander, K. (2014). Embryo transcriptome response to environmental factors: implication for its survival under suboptimal conditions. Animal reproduction science, 149(1-2), 30–38. https://doi.org/10.1016/j.anireprosci.2014.05.015
24. Available on: https://mppn.org/paises_participantes/india/ (accessed on: 19-01-23).
25. Available on: https://mppn.org/paises_participantes/india/ (accessed on: 19-01-23).